3 Customer Support Metrics That Work For Us
Seemingly everyone is boasting about how ‘data-driven’ their business is, which can largely be attributed to how simple it has become to accurately track minute pieces of data. What this has resulted in, are companies that spend too much time tracking hundreds of pieces of data, most of which are not relevant to the bottom line.
As with any piece of your business, customer support has its own specific metrics that actually affect your bottom-line. The concern of many business owners, is how to tell which support metrics will actually make a difference. There are an astounding amount of trackable performance indicators at your disposal, but which group of them will generate results?
We have found that the most effective customer support metrics can be broken down into 3 main categories, customer feedback, customer behavior, and agent/team behavior. Within each of these categories lies 2-3 metrics that a company can unlock and incorporate into their data-driven business.
Customer Feedback
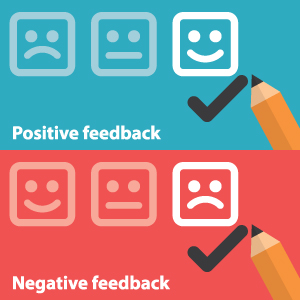
 Customer feedback is the single most important category in regards to support metrics because it shines light on customer satisfaction. Customer satisfaction tells you how things are going in regards to overall support, sales, product development, and marketing.
Every company can benefit by incorporating customer satisfaction metrics into their data-driven business. By requesting surveys after transactions, as well as quarterly surveys from regular customers, it becomes very clear where service performance is improving or declining.
Customer Behavior
 This category of support metric refers to the tracking of items such as contact volume, referrals, product engagement, abandonment rates, and self-service use. By incorporating these metrics into your system, you’ll generate meaningful data that can influence your operations, marketing and sales departments.
Customer behavior can be an effective way into the mindset of your clients, and how engaged/committed they are to your product. By understanding their use of your product, and how likely they are to recommend it, your team can hone processes to better serve them and generate more referrals.
Agent/Team Behavior
 The third category of customer support metric, agent/team behavior, will provide data on how effective your team is, and areas in which they can improve. Metrics for response time, issues per agent, escalation rates and employee turnover can have a substantial impact on how your team operates, and make everyone involved more effective at their job.
For example, by tracking reply times, it becomes much easier to ensure that your customers are receiving timely follow up and not falling through the cracks along the way. With employee turnover, you can take a closer look at employee satisfaction as well as effective management. A team that has a low turnover rate is typically doing certain things right because their employees are remaining satisfied and committed to their jobs. A satisfied employee can more easily create a better overall customer experience.
Ultimately, the goal of these metrics is to help answer the following 3 questions…
-
How much money is customer service helping us bring in?
-
What is customer service costing/saving us?
-
What is customer service doing to help grow our business?
The answers to these questions can all be found within the data if you choose the right metrics. Just remember to set goals, and keep your eyes on the prize. Don’t get intimidated by optimizing all metrics, instead focus on using the RIGHT metrics as a device to drive customer satisfaction.
