Customer satisfaction trends and statistics for 2018
Why is customer satisfaction significant gamechanger in 2019?
Our partner for live chat services, Live Chat Inc., has recently published Customer Service statistics for 2018.
The report is based on the data gathered from January to December 2018 and covers data from 25,000 companies operating in 19 different industries using live chat and tickets for customer service and online sales.
Live Chat had processed information based on 47.4 billion website visits, 437 million chats and 21 million tickets and provided us with a unique overview of trends to take note of in 2019.
Customer satisfaction levels are dropping each year slightly
One can say that the reason for the 1.5% drop in satisfaction level in 2018 suggests the rise of customer expectations. However, the decline can also signalize a shift in the customer journey.
Customer expectation has evolved in the past couple of years:
- Customers require more proactive engagement from their vendors – they want to learn how to benefit the most from the product or service they bought instead of resolving glitches while using it
- Customers envision support as something less transactional, less governed by scripts and with more focus on proactive guidance of customer goals
These characteristics fall within the customer success role. The following role that has risen in the past few years along with the growth of the SaaS products market. Customer success has become more and more blended with traditional customer support in the perception of an average customer.
The fact that the satisfaction level seems to be dropping signalizes a need for a shift in the paradigm of managing a customer’s journey.
Average first response time and average handling time is slightly faster
These metrics show a decline, meaning it takes less and less to get the first response and final issue resolution. However, when compared to customer satisfaction levels dropping, it is clear that the customers don’t put emphasis primarily on a fast resolution. It is the customized feedback that helps customers get value from getting the issue resolved, not just the speed.
The change within the support channels
The trend outlining preference of chats over tickets also implies that businesses require a higher level of interaction when reaching out for support issues. Using a live chat for communication with your customers has become a standard, not an extra feature, that is nice to have.
Issues in delivering exceptional customer satisfaction across industries or company size
The worst customer satisfaction is among mid-sized companies (below 100 employees). In one of our former posts, we have analyzed the challenges for mid-size companies in terms of scaling the business while maintaining low churn levels and high customer satisfaction. Prioritizing takes a toll usually on customer support as it is seen as a cost center, rather than a potential revenue stream by nurturing the relationship through customer success-based approach.
In terms of industries, tech companies have registered the highest customer satisfaction score for the third year in a row, with software and hosting industry leading with highest rates.
Tech companies are also the ones that in majority provide 24/7/365 support, and they try to be available for customers as much as possible. With software, the need to be at a customers disposal means further opportunity to evangelize the product further. The hosting industry has seen a price decline and a technology shift in the past years, which makes the customer support the most relevant differentiator in the market.
Touch Support’s results for 2018 are better than our results from 2017.
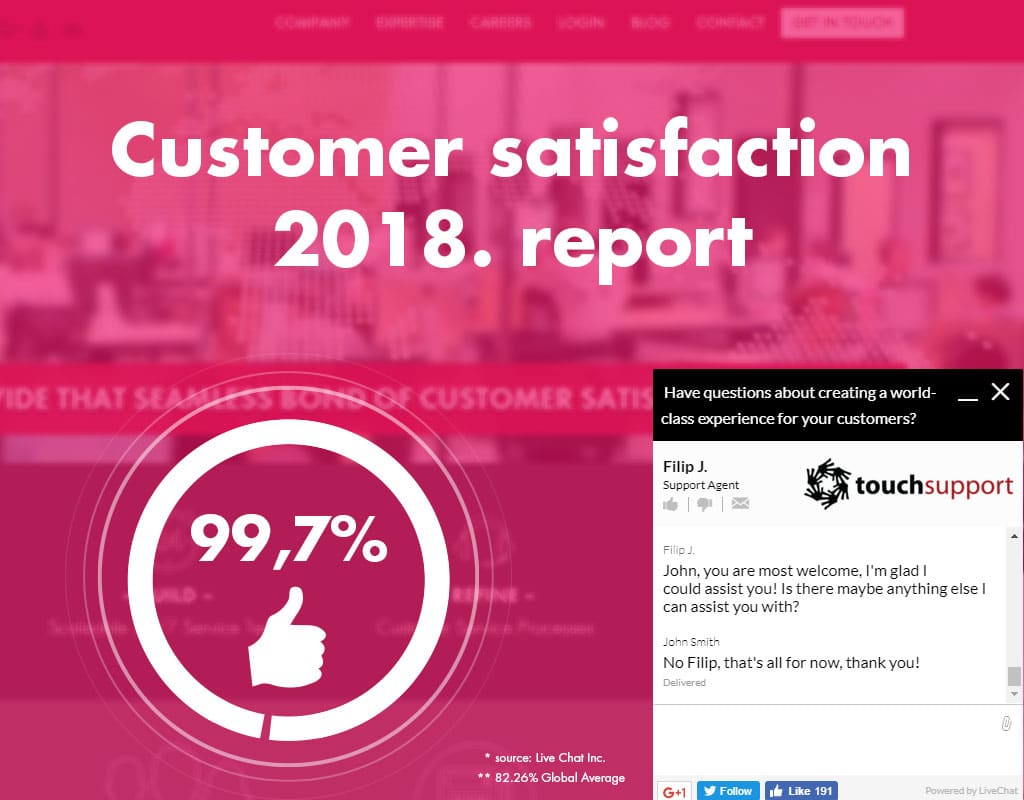
Our customer satisfaction average for 2018 is 17.4% better than the global average at a staggering 99.7%!
Our traditionally good statistics show that we have the experience, methodology, and people needed to support your clients.
Learn how to improve your customer experience and connect with us, we’re happy to help!
